Satellite Imagery of Oceanographic Features
FOREWORD
Satellite imagery is being used more and more in
oceanographic analysis. The use of infrared imagery is especially helpful in
analyzing sea-surface temperature patterns, which in turn permit us to locate
and distinguish features such as oceanic fronts, eddies, and areas of upwelling.
I will not discuss every oceanographic feature visible in
satellite imagery, but I will cover the major features. For a more in-depth
discussion of oceanographic features as observed via satellite, I recommend that
you read volume 2 of the Applications Guide - Environmental Phenomena and
Effects Technical Report 77-04).
OVERVIEW
Identify oceanographic imagery. features seen in satellite
OUTLINE
-
Oceanic fronts
-
Eddies
-
Upwelling
-
Internal waves
-
Sea ice
Using satellite imagery to detect oceanographic frontal
boundaries, eddies, etc., has made our job as Aerographer’s Mates in the world
of ASW easier than in the past. Many features were missed in the past because of
the lack of reports or poor analyis, and many sonar-related problems could not
be adequately explained based on past charts. Observing the oceans through the
eyes of satellites provides for far greater coverage of oceanic features and
greater accuracy in the location and movement of these features.
Learning Objective:
|
Differentiate between permanent and transient oceanic fronts,
and
recognize the differences that occur across frontal boundaries.
|
OCEANIC FRONTS
The mean surface positions of the major oceanic frontal
systems of the world are depicted in figure 3-1-1.
 You
will note that most of the fronts are located along the boundaries of surface
oceanic currents. These fronts are termed "permanent",
because they are observed during all seasons in the same general geographic
location. These fronts do not move significantly from their mean position.
Oceanic fronts that are comparatively short lived and show considerable
variation in location are termed "transient". You
will note that most of the fronts are located along the boundaries of surface
oceanic currents. These fronts are termed "permanent",
because they are observed during all seasons in the same general geographic
location. These fronts do not move significantly from their mean position.
Oceanic fronts that are comparatively short lived and show considerable
variation in location are termed "transient".
Such fronts may exist from a few days to several months.
They are primarily the result of seasonal water changes, regional upwelling,
open-sea convergence and divergences, pronounced surface heating or cooling, or
river runoff.
Oceanic fronts separate water masses of different densities, and since the
density of seawater is a function of temperature and salinity, there are thermal
(temperature) fronts and haline (salinity) fronts. Oceanic fronts are found in
the upper layers of the oceans in areas of pronounced horizontal temperature
and/or salinity gradients. One such area is off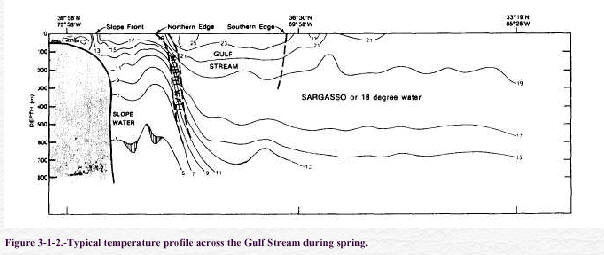 the east coast of the United
States where the Gulf Stream interacts with the much cooler coastal waters and
the cold Labrador current. the east coast of the United
States where the Gulf Stream interacts with the much cooler coastal waters and
the cold Labrador current.
The Gulf Stream front is located in the region of the sharply defined thermal
gradient that exists
between the Gulf Stream water and the coastal waters. A typical vertical cross
section of
temperature across the Gulf Stream during spring is shown in figure 3-1-2. Note
the sharp
vertical temperature gradient on the coastal side of the Gulf Stream. The
persistence of this
gradient has given rise to the term north wall to describe this portion of the
Gulf Stream. The
north wall, as revealed by the temperature contrasts in satellite imagery,
delineates the surface
synoptic location of the Gulf Stream frontal system.
In addition to the
temperature and/or
salinity differences across oceanic fronts, there may be differences in water
color, wave height,
and current velocity.
Oceanic fronts and currents can be monitored in infrared satellite imagery.
Temperature
differences across the frontal zones produce distinct gray shade patterns which
reveal the frontal
systems, including meanders and eddies. Regions of upwelling, river runoff, and
current
boundaries can also be distinguished in imagery through gray shade differences.
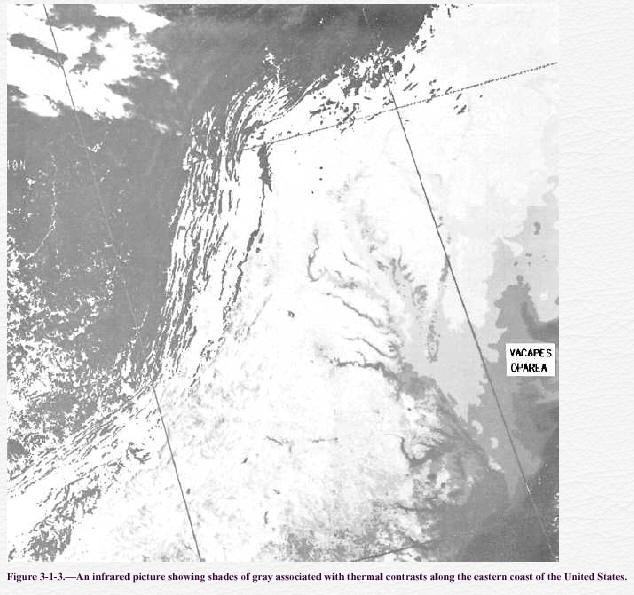 Figure 3-1-3, an
infrared picture taken in March 1988, shows the shades of gray associated with
the thermal
contrasts along the eastern coast of the United States. Figure 3-1-3, an
infrared picture taken in March 1988, shows the shades of gray associated with
the thermal
contrasts along the eastern coast of the United States.
Distinguishing oceanic features in visual imagery is far more difficult than it
is in infrared imagery. It is possibIe to distinguish a front that lies in an
area of sunglint if the difference in sea states across the front is strong
enough to produce light and dark shading in the frontal zone. It is important to
recognize that the oceanic frontal features seen in satellite imagery are those
of the oceans’ upper layers only. Just as meteorological fronts extend upward
into the atmosphere, oceanic fronts extend downward into the ocean.
For example, fronts associated with major currents often
extend to considerable depth (Gulf Stream 3,300 ft; Kuroshio 2,300 ft), while
fronts formed by surface heating and cooling or river runoff are quite shallow
(165 ft, or less).
Below the surface across these fronts, there may be differences in light
transmission, dissolved chemicals, biological population, and sound velocity
propagation. The latter two are very important in sonar applications.
Knowledge of oceanic fronts is extremely important in submarine and
anti-submarine operations, as they are the basis of many tactical decisions.
Learning Objective:
|
Identify the two types of oceanic eddies and the type of
satellite imagery used to locate and differentiate between them.
|
 Oceanic
eddies are distinct, closed cyclonic or anticyclonic circulations. Cyclonic
eddies are generally cold core, while anticyclonic eddies are generally warm
core. But if the temperature of the water increases as you move outward from the
center of an eddy, the eddy is cold cored (coldest temperature at the center),
regardless of the circulation. Oceanic
eddies are distinct, closed cyclonic or anticyclonic circulations. Cyclonic
eddies are generally cold core, while anticyclonic eddies are generally warm
core. But if the temperature of the water increases as you move outward from the
center of an eddy, the eddy is cold cored (coldest temperature at the center),
regardless of the circulation.
Eddies are formed in several different ways. They can develop when a meander in
a major ocean current becomes very large and gets cut off from the main current.
Such formations are similar to the cut-off highs and lows that occur in the
primary circulation patterns found in the atmosphere.
These eddies have diameters that range between tens of miles
to hundreds of miles and, like the currents that form them, their circulations
are strongest near the surface. Eddies are also produced by the deflection
and/or channeling of an ocean current by the shape of the coastline and the
topography of the ocean bottom. Small eddies (tens of miles in diameter) have
also been observed to form from the intrusion of one water into another. The
intruding water bends back towards itself, forming a small rapidly rotating eddy.
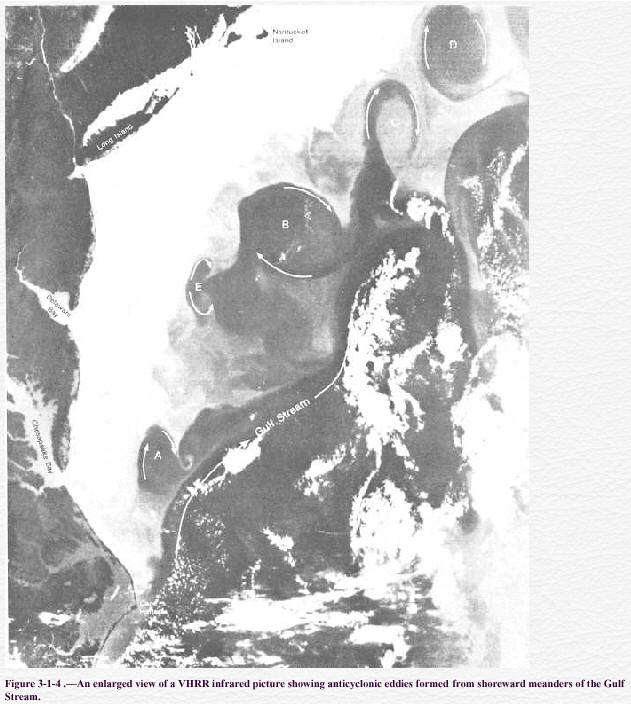
The surface-temperature patterns of oceanic eddies are
visible in infrared satellite imagery. The temperature differences across eddies
produce gray-shade differences. Figure 3-1-4 shows eddies formed by meanders
within the Gulf Stream.
Cold eddies are often partially encircled by a convective
cloud line at their edge, while convective clouds may form directly over warm
eddies.
Cold eddies act as an atmospheric stabilizer by cooling the air directly
overhead, thereby slowing the movement of stronger winds aloft toward the
surface. Thus, there is a tendency for the seas in cold eddies, and cold water
in general, to be less rough than the surrounding warmer waters.
Eddies are also used tactically by submarines because of the sound propagation
differences that exist inside and outside these circulations.
Learning Objective:
|
Identify thermal patterns created by
upwelling. |
UPWELLING
Upwelling in a body of water is a process by
which subsurface water rises toward the surface.
Since water temperature generally decreases with depth, the upwelled
water is colder than the surface water it replaces. Thus,
sea-surface temperatures are characteristically lower in areas of
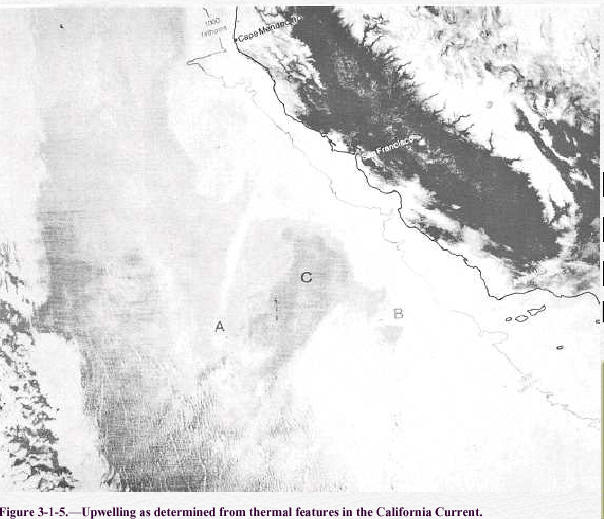
upwelling. Infrared imagery provides information on the position and
strength of the surface thermal gradients associated with upwelled
water. The gray-shade patterns may appear as bands of lighter gray
shades (colder temperatures) extending along coastlines. The pattern
may also show plumes of cold water or cold eddies intruding into the
warmer waters further offshore. See figure 3-1-5.
|
 |
Learning Objective:
|
Recognize how internal waves may be detected using satellite
imagery.
|
INTERNAL WAVES
Internal waves are a wave phenomena in the
ocean that forms between subsurface layers of water of varying
density. In the open ocean, internal waves are frequently found
along the main thermocline in the layer of strong vertical
temperature gradient found below the surface mixed layer.
Internal waves can have a disruptive influence on underwater
sound propagation and must be identified, located, and
interpreted for effects on naval undersea operations.
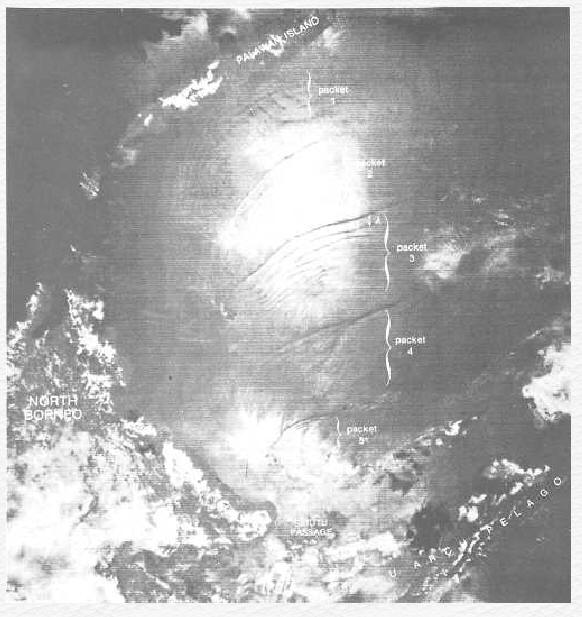
Internal waves cannot be directly observed from satellite
platforms. However, they can be indirectly detected at the
surface in visual imagery. In areas of nearly calm winds and
seas and where sunglint patterns are present, distinctive
alternate bright and dark bands in the sunglint area indicate
the presence of internal waves. Figure 3-1-6 is an enlarged view
of such an occurrence.
|
 |
Learning Objective:
|
Identify methods used to differentiate sea ice from clouds
and snow covered terrain as
seen in satellite imagery.
|
SEA ICE
The detection and monitoring of sea ice conditions is of
vital importance to ships operating at higher latitudes. Icebergs, calved
off ice shelves, and ice floes can pose a danger to ship operations, while
the growth and extent of pack ice can impact fleet and support functions. In
addition, sonar performance is degraded at the edges of and under ice fields,
as sound is scattered and reduced in strength by the ice.
Distinguishing sea ice from clouds or snow-covered terrain is a primary
problem in interpreting satellite imagery. In visual imagery, sea ice often
has a granular structure, and leads of open water are frequently observed
within ice fields. Fields of sea ice are also relatively conservative.
That is, they do not change much from day to day. Clouds, on the other hand,
seldom retain the same shape or remain in the same location for more than a
few hours. Knowledge of the geography and climatology of a region is most
helpful in identifying areas of sea ice,
REFERENCES
Navy Tactical Applications Guide, Volume 2,
Environmental Phenomena and Effects, Tactical Applications Department, Navy
Environmental Prediction Research Facility, Monterey, Calif., January 1979.
|
 Oceanic
eddies are distinct, closed cyclonic or anticyclonic circulations. Cyclonic
eddies are generally cold core, while anticyclonic eddies are generally warm
core. But if the temperature of the water increases as you move outward from the
center of an eddy, the eddy is cold cored (coldest temperature at the center),
regardless of the circulation.
