4.3 Forecasting frontal clouds and weather
LEARNING OBJECTIVES:
|
Evaluate surface and upper level synoptic data in the analysis of
frontal clouds and weather.
|
Cloud and weather regimes most
difficult to forecast are those associated with cyclogenesis. It is well
known that falling pressure, precipitation, and an expanding shield of middle
clouds indicate that the cyclogenetic process is occurring and, by following
these indications, successful forecasts can often be made for 6 to 48 hours in
advance. Most of the winter precipitation of the lowlands in the middle
latitudes is chiefly cyclonic or frontal in origin, though convection is
involved when the displaced air mass is unstable. Cyclones are important
generators of precipitation in the Tropics as well as in midlatitudes.
Factors to be considered in arriving at an accurate forecast are listed below;
these factors are not listed in any order of importance:
-
The source region of the parent air mass.
-
Nature of the underlying surface.
-
The type and slope of the front(s).
-
Wind and contour patterns aloft.
-
Past speed and direction of movement of the low or front(s).
-
Familiarization with the normal weather patterns.
As pointed out earlier, a thorough understanding of the physical processes
by which precipitation develops and spreads is essential to an accurate forecast.
There are unique cloud and precipitation features and characteristics
associated with the cold and warm fronts, as well as orographic barriers. The
following text discusses these features and characteristics.
You will find it helpful to use
constant pressure charts in conjunction with the surface synoptic situation in
forecasting cold frontal cloudiness and precipitation.
When the contours at the 700-hPa level are perpendicular to the
surface cold front, the band of weather associated with the front is
narrow.
|
This situation occurs with a fast-moving front.
If the front is slow moving, the weather and precipitation will extend as
far to the rear of the front as the winds at the 700- hPa level are parallel to
the front.
In both of the above cases, the flow at 700 hPa also indicates the slope of
the front. Since the front at the 700-hPa level lies near the trough line, it is
apparent that when the flow at 700 hPa is perpendicular to the surface front,
the 700-hPa trough is very nearly above the surface trough; hence, the slope of
the front is very steep.
When the 700-hPa flow is parallel to the surface front, the 700-hPa
trough lies to the rear of the surface front and beyond the region in
which the flow continues parallel to the front.
|
Consequently, the frontal slope is more gradual, and lifting is continuing
between the surface and the 700- hPa level at some distance to the rear of the
surface front.
Another factor that contributes to the distribution of cloudiness and
precipitation is the curvature of the flow aloft above the front. Cyclonic flow
is associated with horizontal convergence, and anticyclonic flow is associated
with horizontal divergence.
Very little weather is associated with a cold front if the mean
isotherms are perpendicular to the front.
|
When the mean isotherms are parallel to the front, weather will occur with
the front. This principle is associated with the contrast of the two air masses;
hence, with the effectiveness of lifting.
 Satellite imagery provides a representative picture of the cloud structure
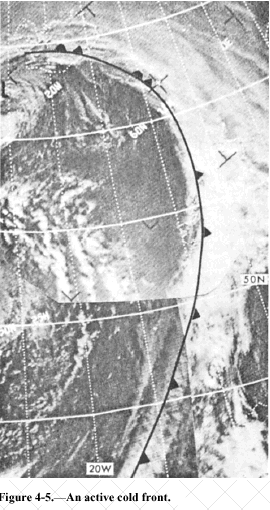
of frontal systems. Active cold fronts appear as continuous, well-developed
cloud bands composed of low, middle, and high clouds. This is caused by the
upper wind flow, which is parallel, or nearly parallel, to the frontal zone
(fig. 4-5). Satellite imagery provides a representative picture of the cloud structure
of frontal systems. Active cold fronts appear as continuous, well-developed
cloud bands composed of low, middle, and high clouds. This is caused by the
upper wind flow, which is parallel, or nearly parallel, to the frontal zone
(fig. 4-5).
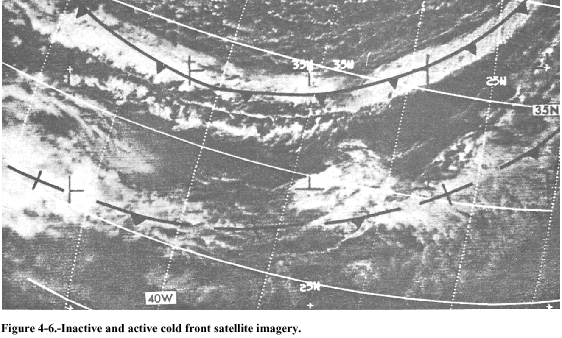
The perpendicular component of the upper winds associated with the inactive
cold front causes the cloud bands to appear as narrow, fragmented, or
discontinuous. The band of clouds is comprised mainly of low-level cumulus and
stratiform clouds, but some cirriform may be present. Occasionally, inactive
cold fronts over water will have the same appearance as active fronts over land,
while overland they may have few or no clouds present. Figure 4-6 depicts the
fragmented clouds associated with an inactive cold front in the lower portion,
while a more active cold front cloud presentation is shown in the upper portion.
As with cold fronts, the use of constant pressure charts in conjunction with
the surface synoptic situation is helpful in forecasting warm-frontal cloudiness
and precipitation.
Cloudiness and precipitation occur where the 700- hPa flow across the
warm front is from the warm air to the cold air, and is moving in a
cyclonic path or in a straight line.
|
This implies convergence associated with the cyclonic curvature.
 Warm fronts are accompanied by no weather and few clouds if the 700- hPa
flow above them is anticyclonic. This is due to horizontal divergence associated
with anticyclonic curvature. Warm fronts are accompanied by no weather and few clouds if the 700- hPa
flow above them is anticyclonic. This is due to horizontal divergence associated
with anticyclonic curvature.
The 700-hPa ridge line ahead of a warm front may be considered the forward
limit of the prewarm frontal cloudiness. The sharper the ridge line, the more
accurate the rule.
When the slope of the warm front is gentle near the surface position, and is
steep several hundred miles to the north, the area of precipitation is situated
in the region where the slope is steep. There may be no precipitation just ahead
of the surface frontal position.
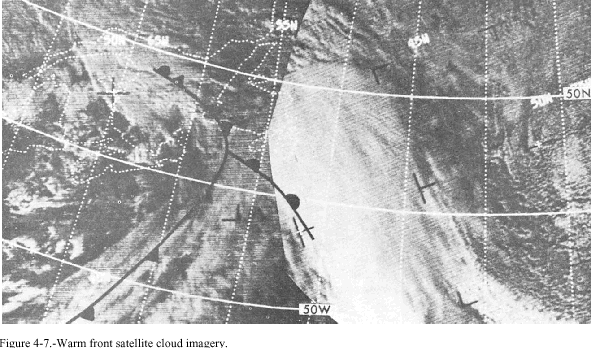
 Warm fronts are difficult to locate on satellite imagery. An active warm
front maybe associated with a well organized cloud band, but the frontal zone is
difficult to locate. An active warm front maybe placed somewhere under the bulge
of clouds that are associated with the peak of the warm sector of a frontal
system. The clouds are a combination of stratiform and cumuliform beneath a
cirriform covering. See figure 4-7. Warm fronts are difficult to locate on satellite imagery. An active warm
front maybe associated with a well organized cloud band, but the frontal zone is
difficult to locate. An active warm front maybe placed somewhere under the bulge
of clouds that are associated with the peak of the warm sector of a frontal
system. The clouds are a combination of stratiform and cumuliform beneath a
cirriform covering. See figure 4-7.
You must remember that no one condition represents what could be called
typical, as each front presents a different situation with respect to the air
masses involved. Therefore, each front must be treated as a separate case, by
using present indications, geographical location, stability of the air masses,
moisture content, and intensity of the front to determine its precipitation
characteristics.
In general, an orographic barrier increases the extent and duration of
cloudiness and precipitation on the windward side, and decreases it on the
leeward side.
If an air mass is lifted over an orographic barrier, and the lifting is
sufficient for the air to reach its lifting condensation level, cloudiness of
the convective type occurs. If the air is convectively unstable and has
sufficient moisture, showers or thunderstorms occur. The preceding situations
occur on the windward side of the barrier.
Curvature (path of movement) of the flow aloft also affects the occurrence
of cloudiness and precipitation. In a cool air mass, showers and cumulus and
stratocumulus clouds are found in those portions of the air mass that are moving
in a cyclonically curved path. In a warm air mass, cloudiness and precipitation
will be abundant under a current turning cyclonically or moving in a straight
line. Clear skies occur where a current of air is moving from the north in a
straight line or in an anticyclonically curved path. Also, clear skies are
observed in a current of air moving from the south if it is turning sharply
anticyclonically. Elongated V-shaped troughs aloft have cloudiness and
precipitation in the southerly current in advance of the troughs, with clearing
at and behind the trough. These rules also apply in situations where this type
of low is associated with frontal situations.
Cellular cloud patterns (open or closed), as shown by satellite imagery, will
aid the forecaster in identifying regions of cold air advection, areas of
cyclonic, anticyclonic, and divergent wind flow.
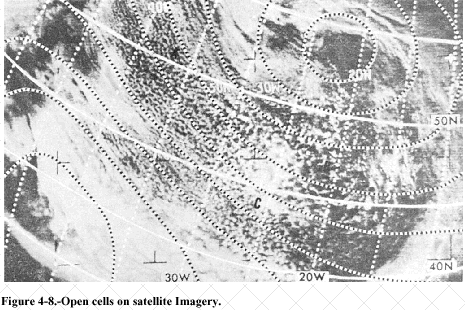
 Open cellular cloud patterns are most commonly found to the rear of cold
fronts in cold, unstable air. These patterns are made up of many individual
cumuliform cells. The cells are composed of cloudless, or less cloudy, centers
surrounded by cloud walls with a predominant ring or U-shape. In the polar air
mass, the open cellular patterns that form in the deep, cold air are
predominately cumulus congestus and cumulonimbus. The open cells that form in
the subtropical high are mainly stratocumulus, cumulus, or cumulus congestus
clusters. For open cells to form in a polar high, there must be moderate to
intense heating of the air mass from below. Open cellular cloud patterns are most commonly found to the rear of cold
fronts in cold, unstable air. These patterns are made up of many individual
cumuliform cells. The cells are composed of cloudless, or less cloudy, centers
surrounded by cloud walls with a predominant ring or U-shape. In the polar air
mass, the open cellular patterns that form in the deep, cold air are
predominately cumulus congestus and cumulonimbus. The open cells that form in
the subtropical high are mainly stratocumulus, cumulus, or cumulus congestus
clusters. For open cells to form in a polar high, there must be moderate to
intense heating of the air mass from below.
When this polar air mass
moves out over the water, the moist layer is shallow and capped by a subsidence
inversion near the coast. Further downstream the vertical extent of the moist
layer and the height of the clouds increases due to air mass modifications by
the underlying surface. In figure 4-8, the open cells
behind a polar front over the North Atlantic indicate cold air advection and
cyclonic curvature of the low-level wind flow. Vertical thickness of the cumulus
at A is small, but increases eastward toward B.
Figure 4-9 shows a large area of the subtropical high west of Peru covered
with open cells. These are not associated with low-level cyclonic flow or steady
cold air advection.
Jets indicate as much individuality with respect to associated weather as do
fronts. Because of the individuality of jetstreams, and also because of the
individuality of each situation with respect to humidity distribution and lower
level circulation patterns, statistically stated relationships become somewhat
vague and are of little value in forecasting.
|
 Satellite imagery provides a representative picture of the cloud structure
of frontal systems. Active cold fronts appear as continuous, well-developed
cloud bands composed of low, middle, and high clouds. This is caused by the
upper wind flow, which is parallel, or nearly parallel, to the frontal zone
(fig. 4-5).
 Warm fronts are accompanied by no weather and few clouds if the 700- hPa
flow above them is anticyclonic. This is due to horizontal divergence associated
with anticyclonic curvature.
 Warm fronts are difficult to locate on satellite imagery. An active warm
front maybe associated with a well organized cloud band, but the frontal zone is
difficult to locate. An active warm front maybe placed somewhere under the bulge
of clouds that are associated with the peak of the warm sector of a frontal
system. The clouds are a combination of stratiform and cumuliform beneath a
cirriform covering. See figure 4-7.
 Open cellular cloud patterns are most commonly found to the rear of cold
fronts in cold, unstable air. These patterns are made up of many individual
cumuliform cells. The cells are composed of cloudless, or less cloudy, centers
surrounded by cloud walls with a predominant ring or U-shape. In the polar air
mass, the open cellular patterns that form in the deep, cold air are
predominately cumulus congestus and cumulonimbus. The open cells that form in
the subtropical high are mainly stratocumulus, cumulus, or cumulus congestus
clusters. For open cells to form in a polar high, there must be moderate to
intense heating of the air mass from below.