Script per studiare la tropopausa* nomefile: tropopausa.gs
'set display color white'
'c'
'set t 1'
'query time'
curtime=subwrd(result,3)
ora_v=substr(curtime,1,2)
giorno_v=substr(curtime,4,2)
mese_v=substr(curtime,6,3)
anno_v=substr(curtime,9,4)
gg_set=subwrd(result,6)
'set grads off'
'set grid off'
'map europe'
'set gxout shaded'
'rgbset2'
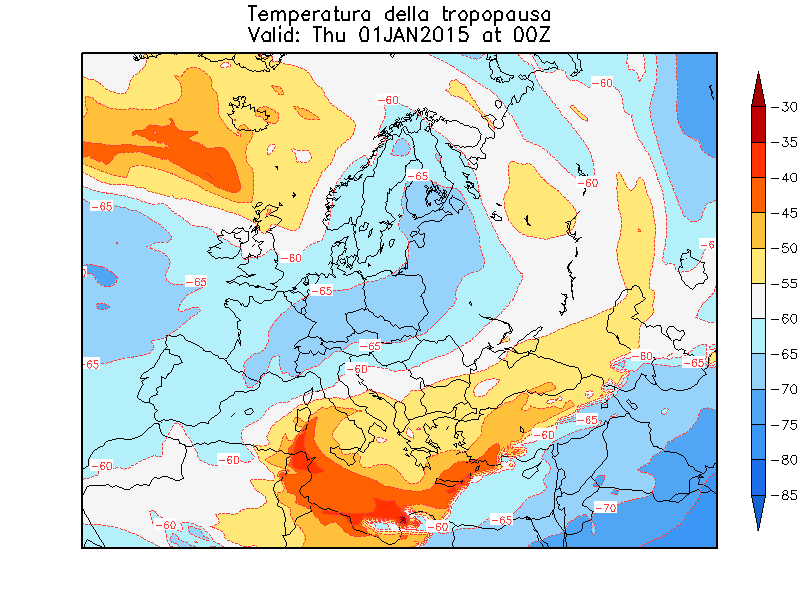
say 'calcolo la temperatura della tropopausa'
'd tmptrop-273.16'
'cbarn'
'set gxout contour'
'set ccolor 2'
'd tmptrop-273.16'
'draw title Temperatura della tropopausa\Valid: 'gg_set' 'giorno_v''mese_v''anno_v' at 'ora_v'Z'
'printim temp_tropopausa.png x800 y600'
'c'
'set t 1'
'set grads off'
'set grid off'
'map europe'
'set gxout shaded'
'rgbset2'
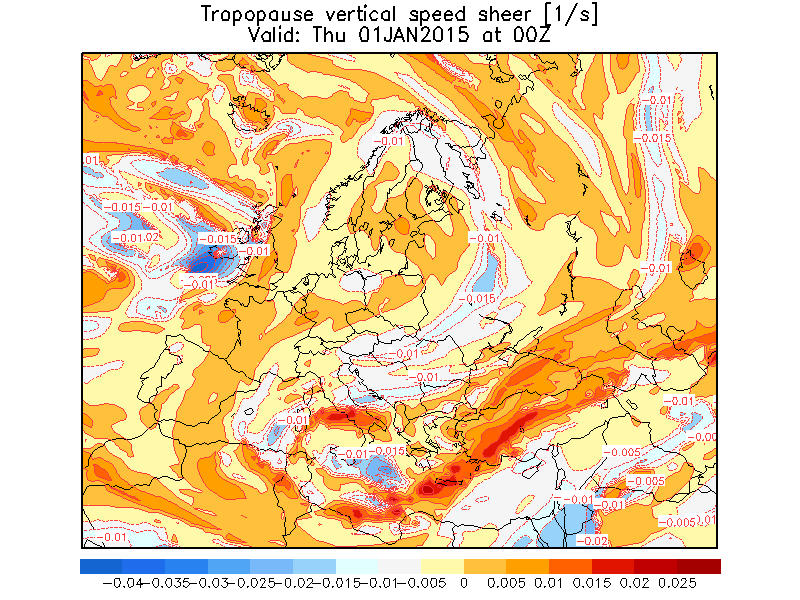
say 'calcolo la vertical speed sheer della tropopausa'
'd vwshtrop'
'cbar'
'set gxout contour'
'set ccolor 2'
'd vwshtrop'
'draw title Tropopause vertical speed sheer [1/s]\Valid: 'gg_set' 'giorno_v''mese_v''anno_v' at 'ora_v'Z'
'printim VSS_tropopausa.png x800 y600'
'c'
'set t 1'
'set grads off'
'set grid off'
'map europe'
'set gxout shaded'
'rgbset2'
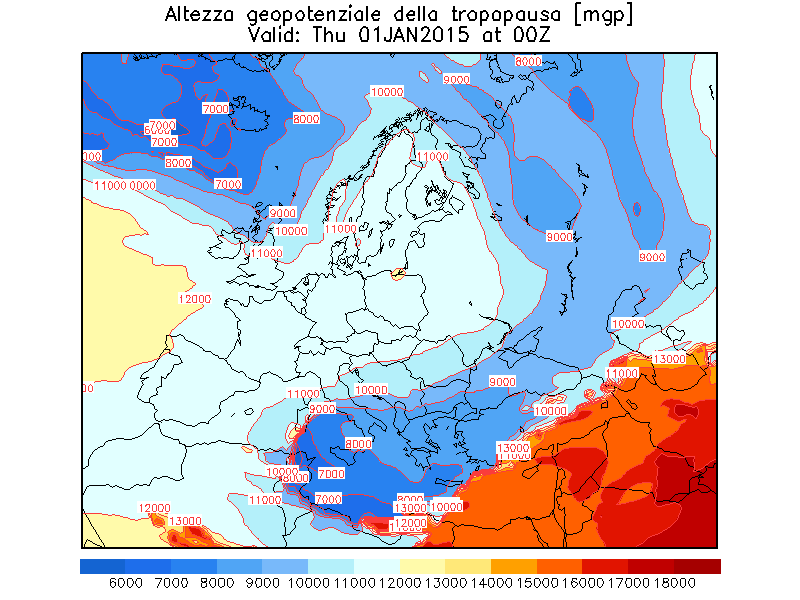
say 'calcolo altezza geopotenziale della tropopausa'
'd hgttrop'
'cbar'
'set gxout contour'
'set ccolor 2'
'd hgttrop'
'draw title Altezza geopotenziale della tropopausa [mgp]\Valid: 'gg_set' 'giorno_v''mese_v''anno_v' at 'ora_v'Z'
'printim altezza_tropopausa.png x800 y600'
'c'
'set t 1'
'set grads off'
'set grid off'
'map europe'
'set gxout shaded'
'rgbset2'
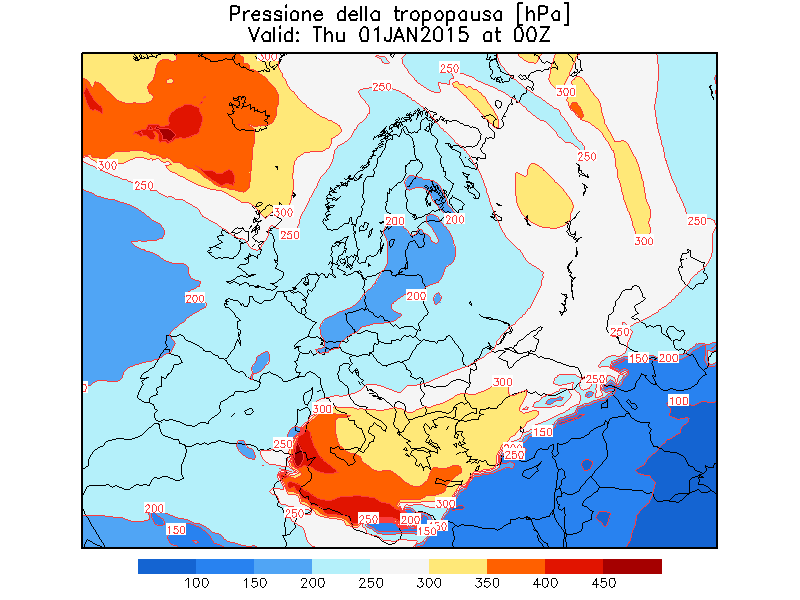
say 'calcolo la pressione della tropopausa'
'd prestrop/100'
'cbar'
'set gxout contour'
'set ccolor 2'
'd prestrop/100'
'draw title Pressione alla tropopausa [hPa]\Valid: 'gg_set' 'giorno_v''mese_v''anno_v' at 'ora_v'Z'
'printim press_tropopausa.png x800 y600'
'c'
'set t 1'
'set grads off'
'set grid off'
'map europe'
'set gxout shaded'
'set ccolor 2'
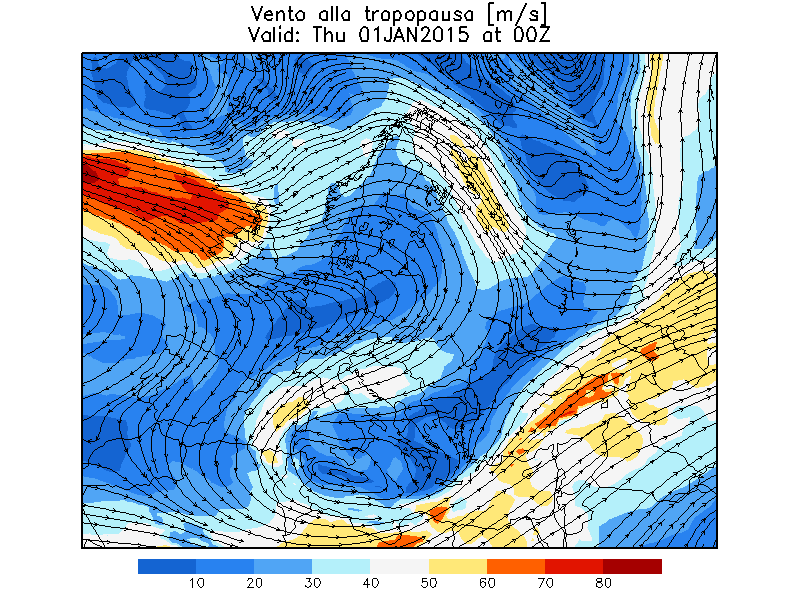
'd mag(ugrdtrop,vgrdtrop)'
'set gxout stream'
'rgbset2'
say 'calcolo il vento alla tropopausa'
'd ugrdtrop;vgrdtrop'
'cbar'
'draw title Vento alla tropopausa [m/s]\Valid: 'gg_set' 'giorno_v''mese_v''anno_v' at 'ora_v'Z'
'printim vento_tropopausa.png x800 y600'
|  
|  |
Note:"The tropopause pressure field is simply the pressure value at the tropopause. I can't think of anything much more complex to consider. Maps of such probably wouldn't offer you any more help in forecasting severe weather than would analyzing a map of 300 mb, 250 mb, or 200 mb heights. They'd tell you almost the same thing. I suppose you can get information on tropospheric folds or the intensity of an upper level trough/disturbance, but again, looking at heights would tell you just about the same thing. I suppose, however, that since the equilibrium level (EL) is a function in some way of the height of the tropopause, then any parameters that are a function of EL are thus a function of tropopause pressure. One such variable is CAPE. Since unstable parcels rapidly become stable with continued upward motion into the tropopause, the lower the tropopause, the lower a parcel will lose its buoyancy and momentum. Another such variable is effective bulk shear. But a parameter like effective bulk shear seems to concentrate on shear in the lower half of the troposphere, so the actual level of the tropopause doesn't have any huge effect on this parameter ." (Jeff Duda). |